By: The Male Cheerleader
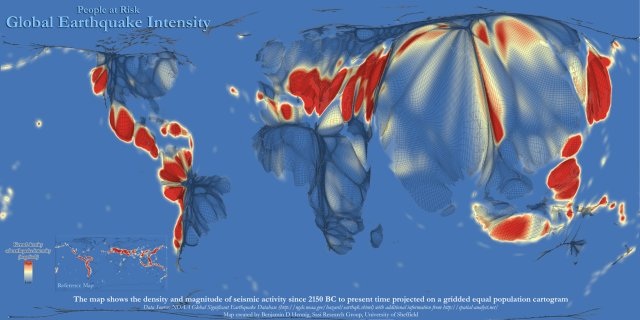
This cartogram is an overlay of population density and earthquake frequency, if you are interested in learning more check out the source link.
Map image is copyright SASI Research Group (University of Sheffield) CC BY-NC-ND 3.0.
[via maptd]
Map image is copyright SASI Research Group (University of Sheffield) CC BY-NC-ND 3.0.
[via maptd]
 RSS Feed